3 AM. Your on-call phone rings. Something is broken. You have 15 minutes before users notice and executives notice after that. With good observability, you grep a log, check a metric, pull a trace, and see the problem in 5 minutes. Without it, you guess, restart things, and hope.
Observability is the set of practices that lets you ask arbitrary questions about your system's behavior without shipping new code. The three pillars — logs, metrics, traces — each answer different questions.
02
The three pillars
Logs
Discrete events with full detail
"User 42 tried to pay $50, got charged, got receipt." One record per interesting event. Rich context, arbitrary fields. Most expensive to store and query. Best for: post-incident forensics, ad-hoc investigation.
Metrics
Aggregated numbers over time
"Requests/sec = 4200" at each timestamp. Very cheap to store (pre-aggregated). Query fast even over weeks. No per-request detail. Best for: dashboards, alerts, SLO tracking.
Traces
End-to-end request flow across services
"Request X took 340ms. 280ms of that was waiting on service B, which waited 200ms on the DB." Connects causes across service boundaries. Best for: diagnosing cross-service latency and cascading failures.
03
The workflows — RED and USE
Two mnemonics for picking metrics.
RED (for services):
Rate — requests/sec
Error rate — % of failed requests
Duration — request latency (P50, P95, P99)
If every service exposes RED metrics, you have enough to answer "is the service healthy?" in seconds.
USE (for resources):
Utilization — % busy (CPU, memory, disk)
Saturation — queue depth, waiting time
Errors — error rate for that resource
If you're trying to understand "why is this host slow?", USE metrics are the starting point.
Exponential moving average for trending detection
class EMA:
    """Smoothed running average with geometric decay."""
    def __init__(self, alpha=0.1):
        self.alpha = alpha  # higher = faster response, noisier
        self.value = None

    def update(self, x):
        if self.value is None:
            self.value = x
        else:
            self.value = self.alpha * x + (1 - self.alpha) * self.value
        return self.value

# For trending: ratio = current_rate / EMA_rate.
# > 1.5x = spiking.  α=0.1 covers ~10 periods; pick for your window.
04
Structured logging
Stop writing log.info("user " + id + " did " + action). Start writing log.info({event:"action", user_id:id, action:action, latency_ms:42}). Structured logs = queryable logs. You can filter for user_id=42 or latency_ms > 100 across millions of events.
Every modern log aggregator (Datadog, Honeycomb, Elasticsearch) indexes structured fields. Unstructured logs force grep and hope. Structured logs let you answer "show me all errors for this user across the last 2 hours" in seconds.
05
Deep dive — distributed tracing with OpenTelemetry
A user request touches 12 services. Which one took 200ms? The answer requires trace context propagation: every service call carries a trace ID + parent span ID in HTTP headers. Each service records its work as a span. Aggregated, you see a flame graph of the whole request.
Implementation via OpenTelemetry (OTel) — the standard replacing older projects (OpenTracing, OpenCensus):
Instrumentation libraries for each language auto-inject spans around HTTP calls, DB queries, message publishes.
Context propagation uses W3C Trace Context headers (traceparent). Headers flow through HTTP, gRPC, even message queues.
Sampling at 1% or 10% — you can't afford to store every trace. High-error or high-latency requests sampled at higher rates ("tail-based sampling").
Backends: Jaeger (OSS), Honeycomb, Lightstep, AWS X-Ray. All speak OTel.
The payoff: one-click navigation from a slow request → flame graph → exact DB query that took 180ms of the 200ms. No more guessing which service is guilty.
06
Real-world
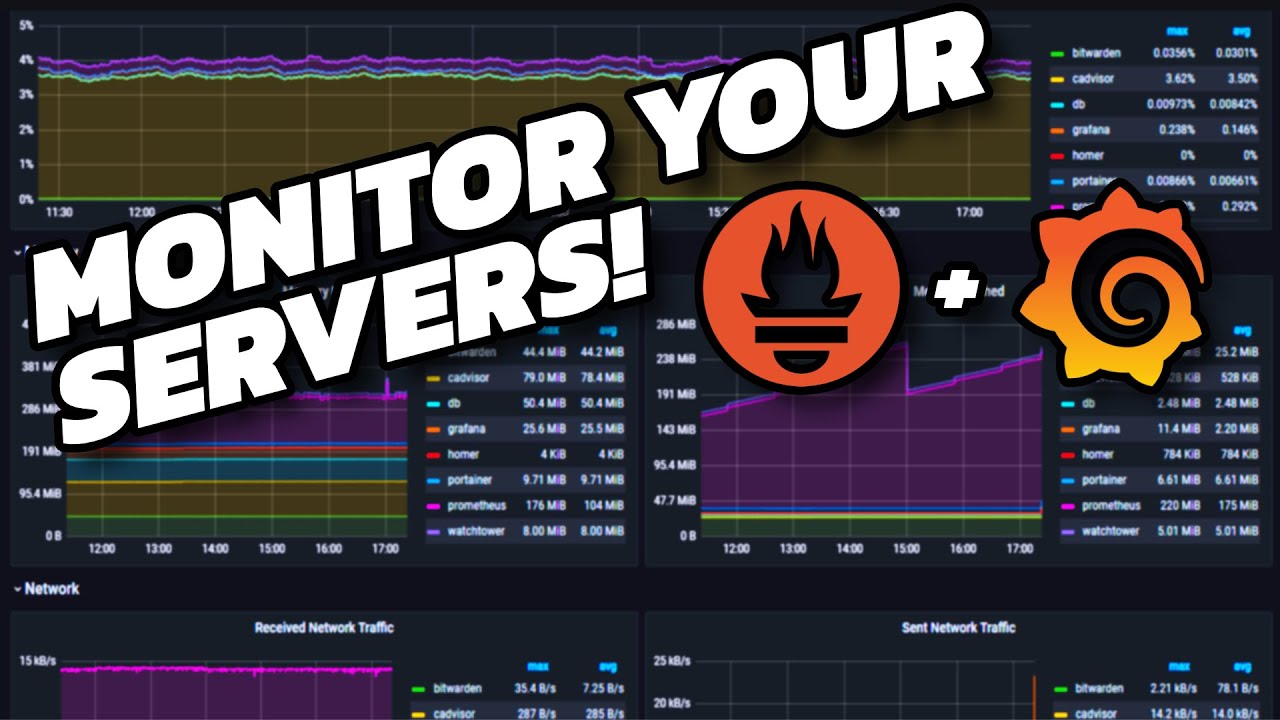
Prometheus + Grafana
Metrics
Scrape-based metrics. Label-rich queries. Grafana dashboards. The open-source standard for metrics.
ELK / Loki
Logs
Elasticsearch + Logstash + Kibana: search and analyze. Loki (Grafana's alternative): cheaper, label-based indexing like Prometheus.
Jaeger / Tempo
Traces
OpenTelemetry-native. Handles billions of spans. Fast flame-graph UI.
Datadog / Honeycomb
Commercial unified platforms
All three pillars in one UI. Pricey at scale but one cohesive experience. Honeycomb specifically pioneered "wide events" — structured logs used as metric + trace source.
07
Used in problems
Distributed logging problem literally designs the log-ingest pipeline. Payment gateway uses all three for forensics during charge disputes. Rate limiter exposes metrics for limit decisions so you can tune without code changes.